Create and manage tables
Tables are a subset of workbook data elements.
Their spreadsheet-like interface allows for structuring and manipulation of data in a familiar environment. Tables support much of a traditional spreadsheet's functionality, like creating calculations and applying filters and formats.
Requirements
-
To create or edit a data element, you must have a creator license and the workbook must be saved to your team or My Documents folder.
For more information on Creator Licenses, reach out to your Client Success Manager or client.success@getbuilt.com.
Create a Table
Tables and other data elements can be created via the PAGE ELEMENTS section of your workbook's editor panel or directly from an existing data element.
Table Concepts
Columns, not Cells
If you're familiar with traditional spreadsheet tools, such as Excel, you likely associated data and formulas with individual cells. While Built tables are very spreadsheet-like, data is managed at the column level rather than on individual cells. This means actions such as calculations and formatting changes are applied to every cell in a column.
Managing data at the column level ensures consistency and accuracy, and prevents common errors, across large and ever-growing sets of data.
Groups and Groupings
Groups and groupings, which are unique to tables, are an excellent tool for comparative analytics. They allow you to analyze rows of data based on shared values within a single column.
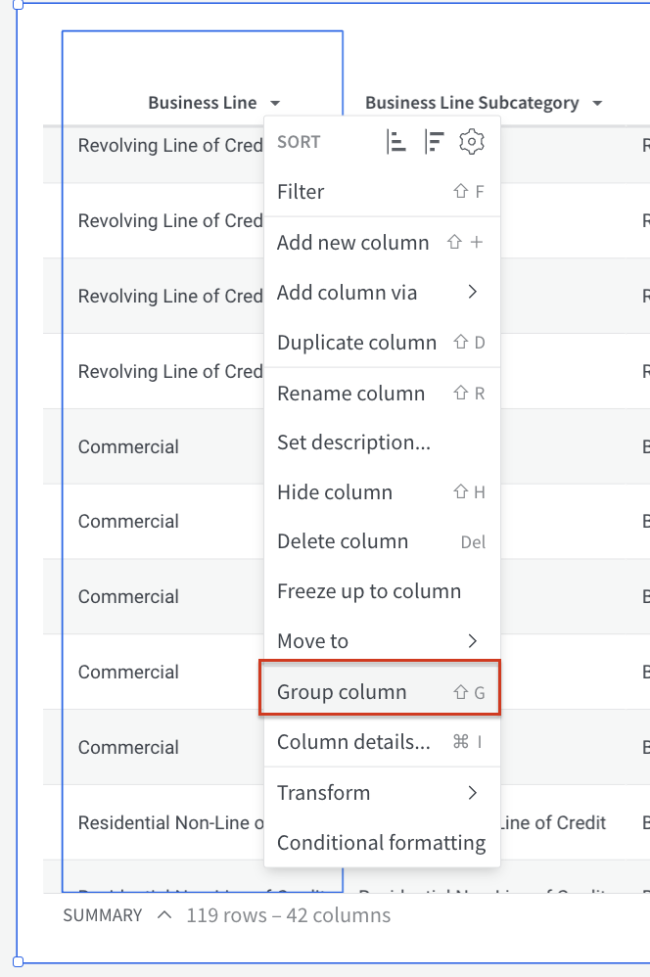
Any column in a table can be used to define a grouping. Right click on the column header and select Group Column. When used to define a grouping, the column becomes what we call a grouping key. Its individual rows merge into single cells based on their distinct values. Subsequently, the rows of data to the right of the key column in the table are bundled into groups based on each unique value in the key column.
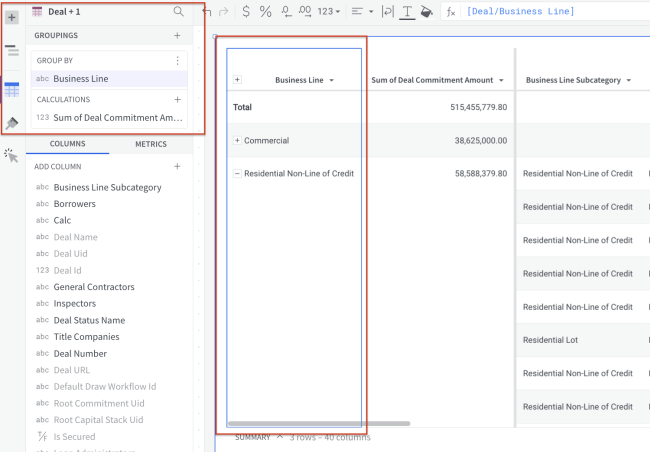
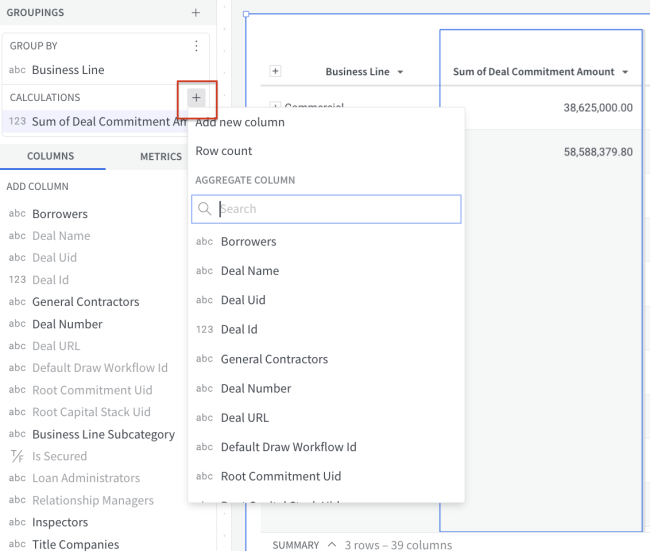
Group aggregates can then be calculated based on the cell values within each row in the group. To create a group Aggregate, select the column header of the grouped column to display the Groupings menu. Next to Calculations click +. Search for the column you would like to aggregate based on the grouping.
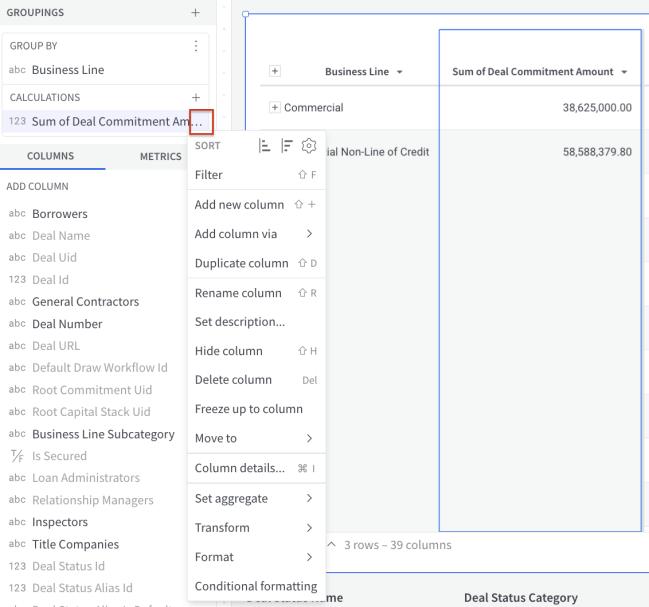
Once created, you can format the calculated column by accessing the additional options in the drop down menu next to the Calculation. Here you can customize formatting, set the aggregation type, or take additional action on the column.
Add a Column & Create a Calculation
Add a New Column
Before you start: This action uses the editor panel. If you have not done so already, open the editor panel from Edit mode.
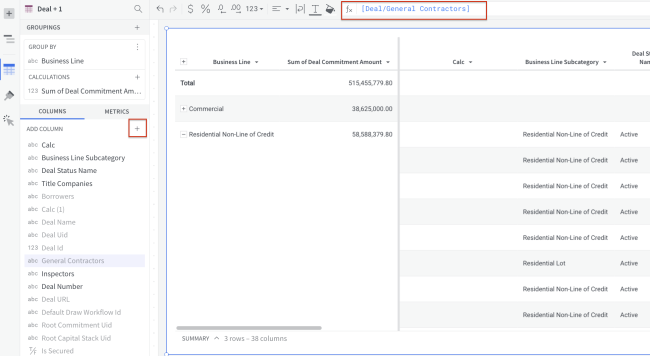
| 1. | In the element's editor panel, click the plus (+) button located to the left of the COLUMNS section header. |
| 2. | Select New column to create a new calculation or View source columns to select a column from the element's data source. |
-
New column adds a new calculated column to the table and focuses the formula bar. Enter your calculation in the formula bar.
-
View source columns expands the full list of the element's available data source column. Check the box next to a column to add it to your table.
Create a Calculation
The formula bar is central to calculating data in Built. It is located in the workbook toolbar at the top of any workbook page. Calculations are applied to entire columns. If a data element's column is selected, the column's formula will appear in the formula bar. No formula will be displayed if no columns selected.
Before you start: This action uses the editor panel. If you have not done so already, open the editor panel from Edit mode.
| 1. | Add a new column. |
| 2. | With the column selected, type your formula into the formula bar. |
It will suggest auto-completed function names and column names.
| 3. | Once your formula is complete, hit Enter on your keyboard, |
or
click the green checkmark to the right of the formula bar.
Collapse and Expand Groups
Table groupings can also be expanded and collapsed by both columns and rows. To do this, click the plus (+) and minus (-) buttons on a grouping key's column header and cells.
Create Row Subtotals
Before you start: This action uses the editor panel. If you have not done so already, open the editor panel from Edit mode.
| 1. | Hover over the grouping key column, and click its caret (▼) button. |
This will open the column's menu.
| 2. | Select Show totals. 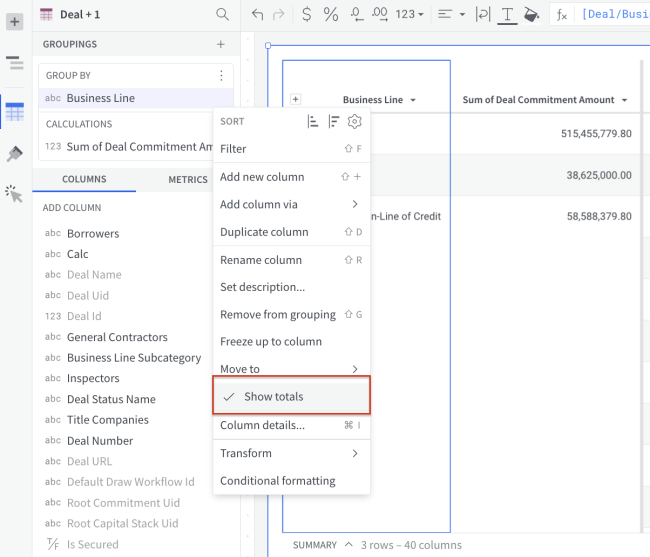 |
Maximize the Table View
When viewing, exploring, or editing a workbook, all data elements are minimized by default to display multiple elements in the canvas. You can maximize any data element to focus on its details and explore the underlying data.
When a table is maximized, it expands to fill the entire workbook page. Unlike maximized visualizations and pivot tables, the underlying data doesn't need to be displayed in an additional table since it's already exposed in the table itself.
Note: Data elements can be maximized in any workbook mode (View or Edit), but changes can be made in Edit mode only.
Column Formatting
Apply Basic Visual Formatting to a Column
Before you start: This action uses the editor panel. If you have not done so already, open the editor panel from Edit mode.
| 1. | Click to select the table. |
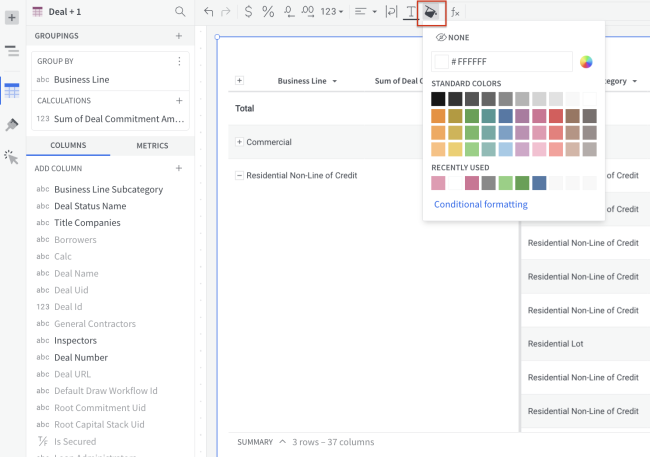
| 2. | Click the paint bucket button in the workbook toolbar. |
| 3. | Select the column's formatting. |
Apply Conditional Formatting
Before you start: This action uses the editor panel. If you have not done so already, open the editor panel from Edit mode.
| 1. | Click to select the table. |
| 2. | Click the paint bucket button in the workbook toolbar. |
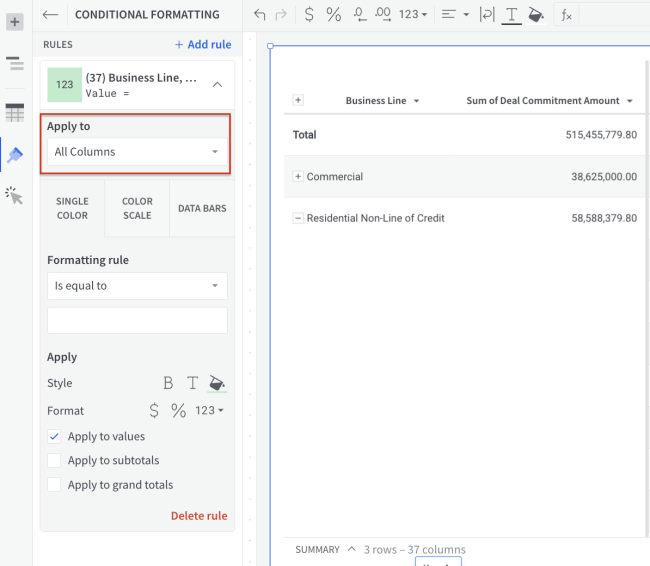
| 3. | Click Conditional formatting. |
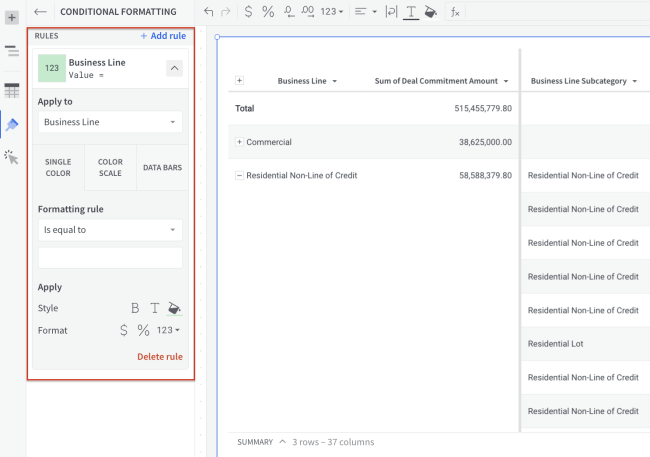
| 4. | The table's conditional formatting options will appear in the editor panel. The selected column will automatically receive a default format. |
Define your new rule.
| 5. | [optional] To add additional rules, click + Add rule. |
One step further!
Say you want to highlight an entire row based on the values of a single column. To do this, simply select "All Columns" in the Apply To dropdown, and use the custom formula option in the rule dropdown with your logic. Example below.