Working with pivot tables
Requirements
-
To create or edit a data element, you must have Can Edit access to the individual workbook. You must have a Creator License and the report must be saved to your team or my documents folder.
-
Some exploratory actions are also supported with Viewer access.
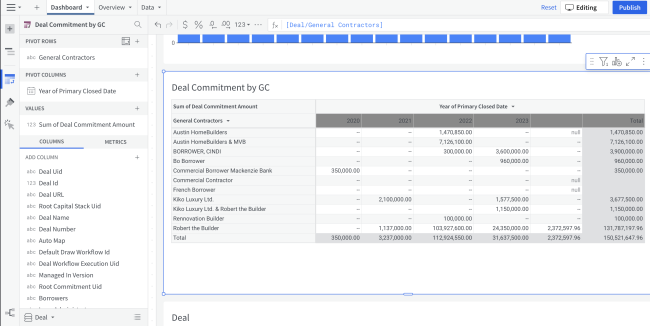
Plot a Pivot Table
Pivot tables and other data elements can be created via the PAGE ELEMENTS section of your workbook's editor panel or directly from an existing data element.
Pivot table data will not display on the page canvas until at least one plot field is defined.
Add columns to open fields using either the field's + menu or dragging and dropping the column.
Required Fields
-
PIVOT ROW (1+ columns) and/or PIVOT COLUMN (1+ columns)
-
VALUE (1+)
Columns added to the VALUE field are aggregated by default. Aggregation type (e.g. Sum vs Count) is dependent on the original column’s value type (e.g. text, number, date, etc).
Optional Fields
All pivot table fields are categorized under required fields (see section above).
Pivot Table Format Options
To begin editing an element's format options:
Before you start: This action uses the editor panel. If you have not done so already, open the editor panel from either Explore or Edit mode; see Workbook modes.
| 1. | Select  Element format in the side navigation. Element format in the side navigation. |
| 2. | Click a format category to view and edit its settings. |
The following format categories are available for pivot tables:
-
Background
-
Title
-
Grid (show row grid, show column grid)
Column Formatting Options
The following column formatting options are available:
-
Alignment
-
Font color
-
Background color
-
Conditional formatting
Apply Basic Visual Column Formatting
The following instructions are applicable to column alignment, font color, and background color.
Before you start: This action uses the editor panel. If you have not done so already, open the editor panel from either Explore or Edit mod; see Workbook modes.
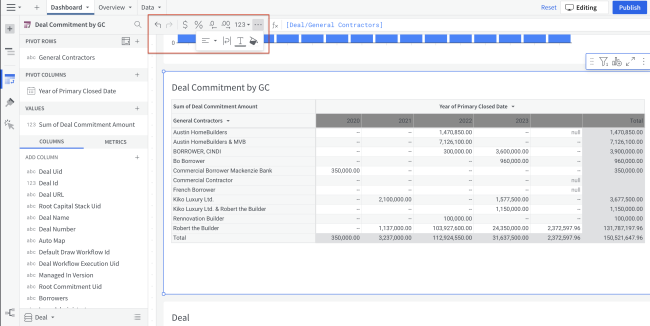
| 1. | Select the column you want to format. |
| 2. | Click the paint bucket button in the workbook toolbar. |
| 3. | Select your formatting options. |
Apply Conditional Formatting
Before you start: This action uses the editor panel. If you have not done so already, open the editor panel from either Explore or Edit mode; see Workbook modes.
| 1. | Select the element. |
| 2. | Click the paintbrush button in the workbook sidebar. |
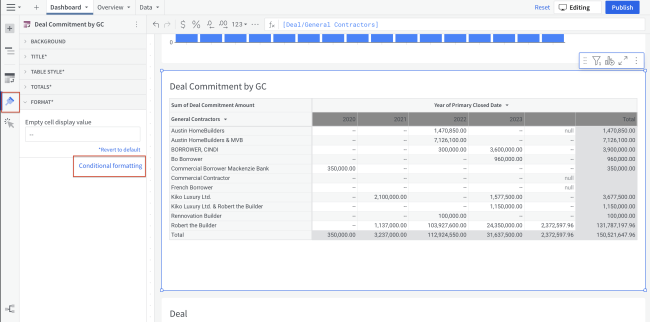
| 3. | Click Conditional formatting. |
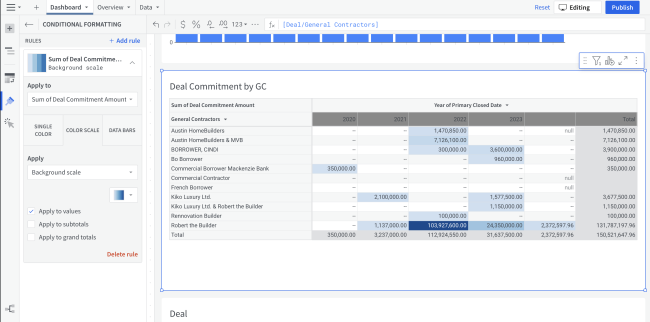
| 4. | Click + Add rule. |
| 5. | Customize the rule and/or add additional rules. |
 =
=
Aggregate a Pivot Table's VALUES
Columns added to a pivot table’s VALUE field are automatically aggregated. Numeric columns are aggregated by Sum, while text and date columns are aggregated by Count.
To change a column's aggregation:
Before you start: This action uses the editor panel. If you have not done so already, open the editor panel from either Explore or Edit mode; see Workbook modes.
| 1. | In the editor panel, hover over the column, and click its caret ( This will open the column's menu. |
| 2. | Select a new aggregate type from the Set aggregate submenu. |

Add a Calculated Column to a Pivot Table
Before you start: This action uses the editor panel. If you have not done so already, open the editor panel from either Explore or Edit mode; see Workbook modes.
| 1. | Select the pivot table. |
| 2. | Click the VALUES section's plus (+) button. |
| 3. | Select New column. |

This will automatically add a new column under VALUES and activate the formula bar.
| 4. | Enter your formula. Then hit Enter on your keyboard. |

Pivot Columns and Rows
Before you start: This action uses the editor panel. If you have not done so already, open the editor panel from either Explore or Edit mode; see Workbook modes.
| 1. | Select the pivot table. |
| 2. | In the editor panel, click the swap rows/columns button, located to the right of the PIVOT ROW header.  |
Maximize the Pivot Table View
When viewing, exploring, or editing a workbook, all data elements are minimized by default to display multiple elements in the canvas. You can maximize any data element to focus on its details and explore the underlying data.
When a pivot table is maximized, it expands to the full width of the workbook page and displays the element's underlying data table. Because the element and underlying data are inherently linked, changes applied to one are automatically reflected in the other.
Note: Data elements can be maximized in any workbook mode (View, Explore, or Edit), but changes can be made in Explore and Edit modes only.